

Key Takeaways
Our Verdict
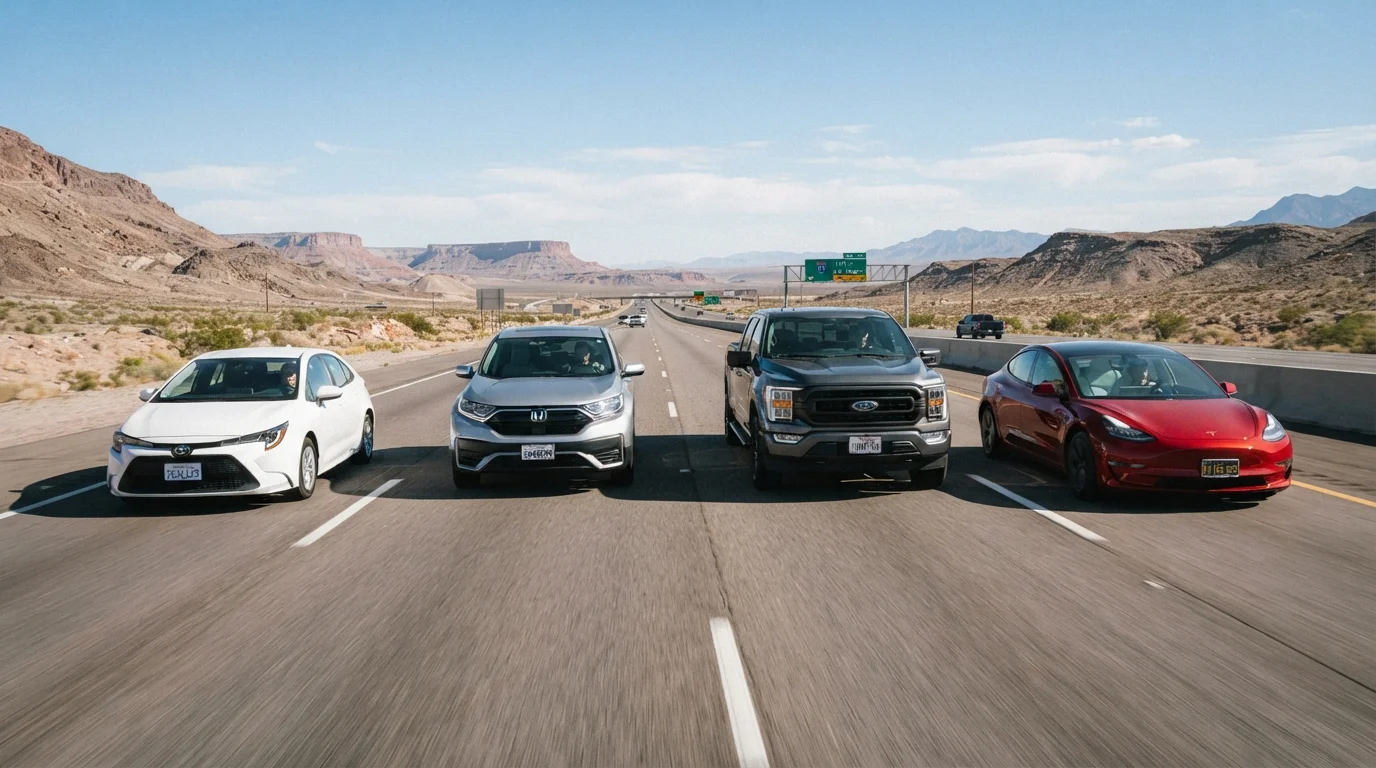
Sedans remain the most cost-efficient choice for the majority of American drivers when all ownership expenses are added up. SUVs offer a reasonable middle ground for those needing more space, while trucks carry a genuine cost premium that only makes sense if their capability is regularly used. EVs are increasingly competitive on annual running costs, though higher upfront prices and insurance rates affect the overall picture.
| Best for | Recommended |
|---|---|
| Budget-conscious daily commuters | Sedan |
| Families needing versatility and space | SUV |
| Drivers who regularly tow or haul | Pickup Truck |
| High-mileage drivers focused on long-term fuel and maintenance savings | Electric Vehicle (EV) |
Why Vehicle Type Changes the Math
Choosing a vehicle is rarely just about the sticker price. The real financial picture emerges over time, once fuel bills, insurance premiums, maintenance invoices, and depreciation are folded in. For a plain-English breakdown of every cost category, it helps to understand what each line item means before comparing vehicle types.
Annual ownership costs vary substantially across sedans, SUVs, pickup trucks, and electric vehicles (EVs). According to AAA's annual Your Driving Costs study, average total ownership costs for new vehicles have climbed well above $10,000 per year when all expenses are included. But that average obscures wide variation by category - and knowing where your chosen vehicle type lands can sharpen your budget considerably.
$12,182
Average annual new-vehicle ownership cost
AAA's Your Driving Costs study estimates this figure for a new vehicle driven 15,000 miles per year, covering all major expense categories.
~45%
Share of total cost from depreciation
Industry analysts consistently identify depreciation as the single largest component of vehicle ownership cost over a five-year period.
40%+
EV maintenance cost reduction vs. gas
Studies from the U.S. Department of Energy suggest battery electric vehicles can cost over 40% less to maintain annually than comparable internal-combustion vehicles.
How Each Vehicle Type Stacks Up
The comparison below reflects general cost ranges across four major vehicle categories. Figures represent typical annual ownership costs for a new vehicle driven roughly 15,000 miles per year, drawing on industry benchmarks. Individual results vary by model, location, and driving habits.
| Sedan | SUV (Midsize) | Pickup Truck | Electric Vehicle | |
|---|---|---|---|---|
| Avg. Annual Depreciation | ~$2,500-$3,500 | ~$3,500-$5,000 | ~$4,000-$6,000 | ~$4,000-$6,500 |
| Annual Fuel / Energy Cost | ~$1,400-$1,900 | ~$1,800-$2,800 | ~$2,500-$3,500 | ~$600-$1,200 |
| Annual Insurance Cost | ~$1,300-$1,700 | ~$1,500-$2,000 | ~$1,600-$2,100 | ~$1,800-$2,500 |
| Annual Maintenance & Repairs | ~$700-$1,100 | ~$800-$1,300 | ~$900-$1,400 | ~$500-$900 |
| Typical Total Annual Cost | ~$7,000-$9,000 | ~$9,000-$12,000 | ~$11,000-$14,000 | ~$9,500-$13,000 |
| Fuel Economy (MPG or MPGe) | 28-40 MPG | 22-30 MPG | 15-22 MPG | 90-130 MPGe |
| Resale Value Retention | Moderate | Moderate-Good | Good (long term) | Variable |
For a deeper look at how geography shapes what your car really costs, state-by-state differences in fuel prices, registration fees, and insurance rates can shift these figures meaningfully.
The Biggest Cost Drivers by Category
Sedans
Compact and midsize sedans consistently post the lowest total annual costs. Lower purchase prices mean smaller loan payments and less depreciation loss. Insurance tends to be more affordable because repair costs and vehicle values are lower. Fuel economy is also generally better than larger vehicles, keeping fuel expenditure in check.
SUVs
Small crossovers sit close to sedans in overall cost, but midsize and full-size SUVs step up noticeably - driven by higher purchase prices, heavier depreciation, greater fuel consumption, and higher insurance premiums. Their broader utility can justify the premium for families, but drivers who rarely use the extra capacity pay for it year-round.
Pickup Trucks
Full-size trucks carry the heaviest annual cost burden of any common category. Fuel costs are significant, depreciation on new trucks is steep in early years, and insurance reflects higher repair and replacement costs. That said, trucks retain resale value better than most vehicle types after the initial ownership period - a nuance worth noting for those who keep vehicles long-term.
Factor In Total Cost, Not Just the Payment
Monthly loan or lease payments are only one piece of the ownership puzzle. Before committing to a vehicle category, add up expected fuel, insurance, and maintenance costs alongside the payment to get a realistic monthly figure. Tools like a realistic monthly car budget calculator can help you build that full picture before you sign.
Electric Vehicles
EVs present a split cost profile. Fuel (electricity) and maintenance costs are genuinely lower - EVs have fewer moving parts, no oil changes, and reduced brake wear thanks to regenerative braking. However, higher purchase prices and elevated insurance premiums (driven by costly battery repair and replacement) offset those savings in annual terms. The long-term cost comparison between EVs and gas vehicles shows that the financial advantage often grows the longer you own the vehicle.
What These Numbers Don't Capture
Averages can obscure as much as they reveal. A number of factors can push your actual costs above or below what any category benchmark suggests:
- Trim level: A base sedan and a fully loaded version of the same model can differ by thousands in insurance and depreciation annually.
- Driving volume: High annual mileage accelerates depreciation and maintenance costs across all categories. See why high-mileage cars cost more than people expect.
- Age of vehicle: Used vehicles typically carry lower depreciation and insurance costs but may have higher maintenance expenses.
- Hidden expenses: Registration fees, dealer add-ons, and unexpected repair bills are costs that catch new car owners off guard more often than not.
Running a annual vehicle cost audit is one practical way to track where your actual spending lands relative to these benchmarks - and identify where you might trim expenses without compromising safety or reliability.
This article provides general cost information for educational purposes only. Actual vehicle ownership costs vary by model, location, insurer, and individual circumstances. Consult a licensed financial professional or insurance agent for advice tailored to your situation.